The Steepest House-Price Fall of Any Big American City
Austin led every major American metro into the correction, and it is leading the way down.
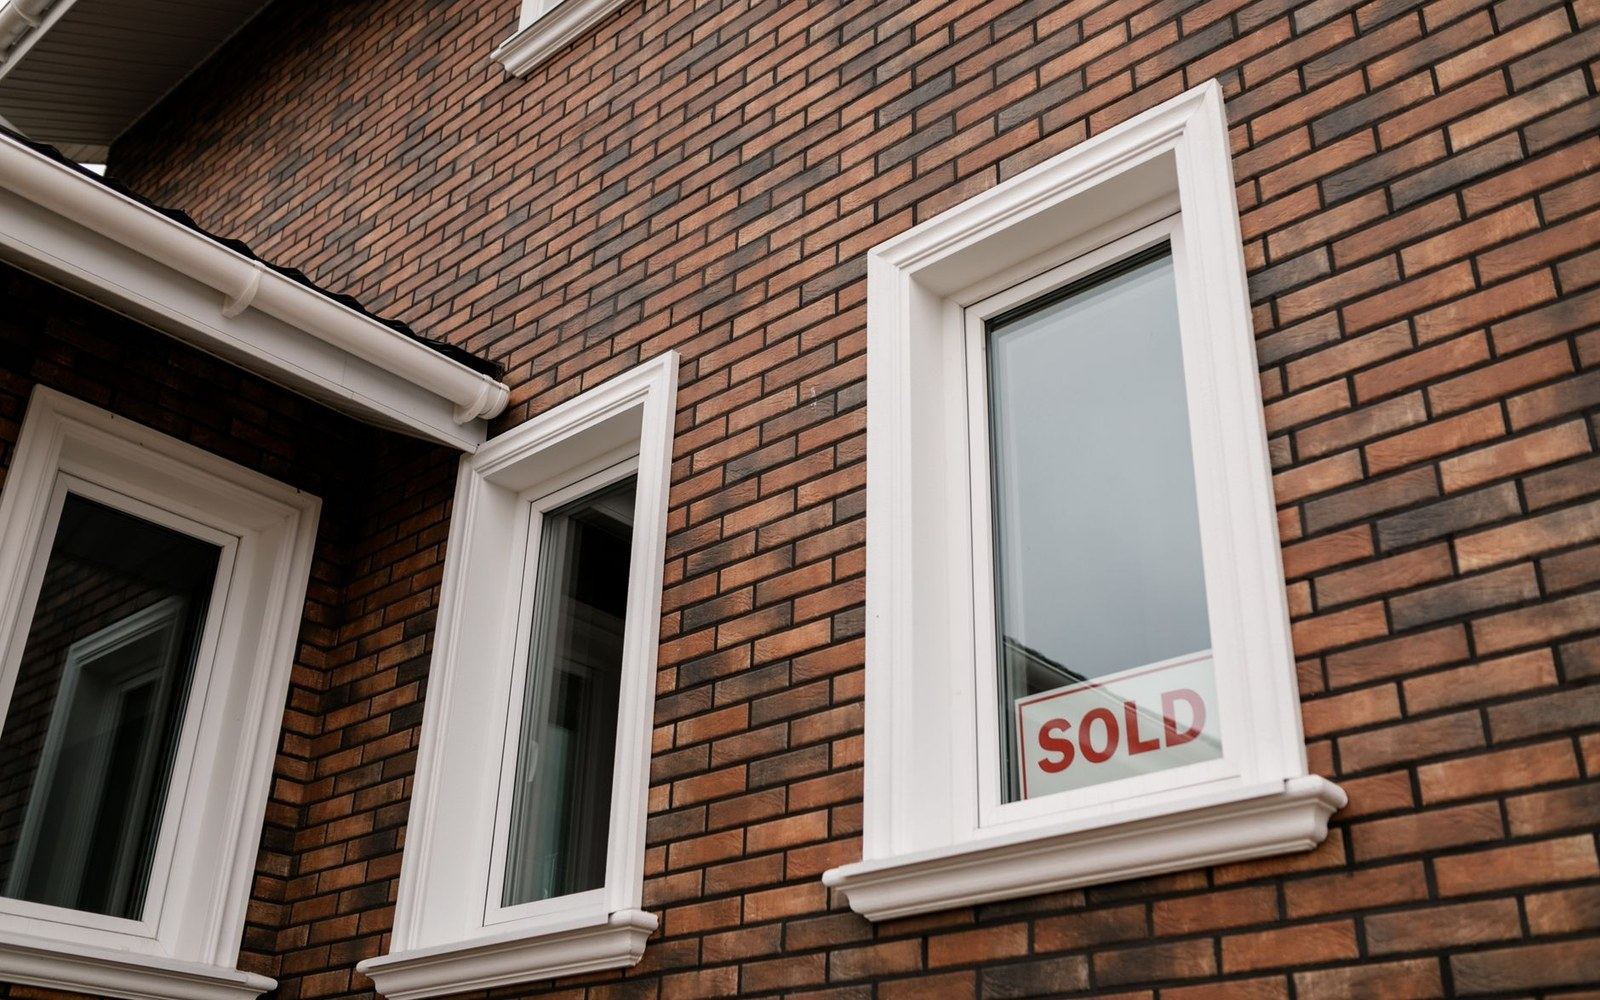
A sale closing after the peak: the outer-ring subdivisions gave back the most.
Photo: Alena Darmel / Pexels
The Peak and How It Was Built
The Austin metro median sale price crossed $550,000 in April 2022, according to Austin Board of Realtors data — a figure that, measured against the pre-pandemic baseline of roughly $300,000 in early 2020, represented an increase of more than 80 percent in roughly two years. No comparably sized American metro compressed that much appreciation into that short a window. The climb was not a single-cause event: record-low mortgage rates, remote-work relocations that drew buyers from California and the Pacific Northwest, a cluster of high-profile corporate arrivals, and an inventory so thin that homes routinely closed above asking price within days of listing all fed the same spiral. The result was a median that briefly made Austin more expensive than much older, denser coastal cities.
Understanding the decline without that context produces a misleading number. A 20-percent drop from a price inflated by 80 percent is not a return to normalcy; it is a partial correction of a distortion, and the floor is not predetermined. That framing — run-up first, correction second — is the only honest way to read what the Austin Board of Realtors and Zillow have published quarterly since mid-2022.
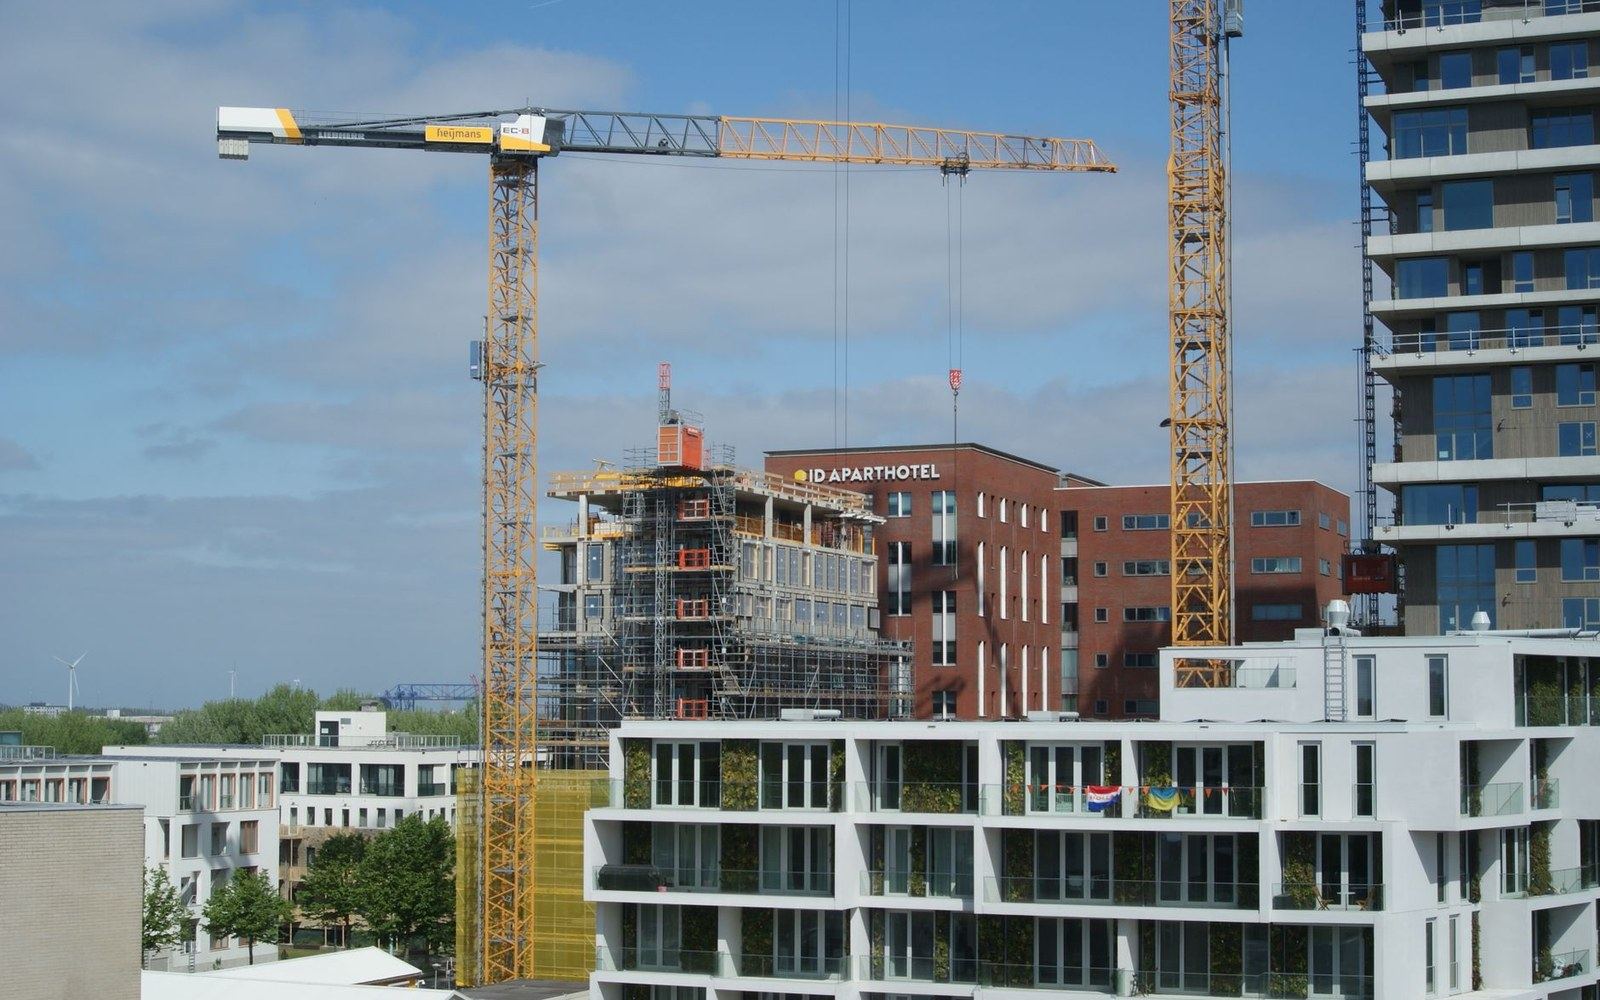
Completions per head led the country while asking rents were already falling.
Photo: Timothy Huliselan / Pexels
What the Data Shows
By mid-2023, the Austin metro median sale price had retreated to approximately $450,000, a decline of roughly 17 percent from the April 2022 peak, according to Austin Board of Realtors monthly reports. By early 2025, Zillow's observed data placed the metro median in a range that represented a cumulative drop of more than 20 percent from the peak — a figure no other major American metro had matched over the same period. Redfin's city-level data for the City of Austin proper showed steeper intra-city declines in some zip codes, particularly in the outer ring neighborhoods that had appreciated fastest when buyers priced out of the core moved farther east and south.
The comparison to peer metros matters. Phoenix, which experienced a comparable pandemic-era run-up, saw median prices fall roughly 10 to 12 percent from its peak before stabilizing. Denver declined modestly. Boise, Idaho — another remote-work magnet — fell sharply but is a much smaller market. Among metros with populations exceeding one million, Austin's percentage decline from peak stood as the largest recorded through 2024. The National Association of Realtors' metropolitan-area price data confirmed Austin's outlier status relative to other Sun Belt markets.
Several structural factors explain why Austin fell faster and further than Phoenix or Dallas. First, the city built aggressively: apartment completions per capita in the Austin metro led the nation in 2023 and 2024, according to Census Bureau building permit data, adding supply at a rate that absorbed and then exceeded demand. Second, tech-sector contraction hit Austin with particular severity after 2022, as Tesla, Apple, and other major employers either paused hiring or issued WARN notices signaling layoffs, reducing the pool of high-income buyers who had sustained the peak. Third, mortgage rates rising from sub-3 percent to above 7 percent in 2022 and 2023 destroyed affordability at the top of the price range — exactly where Austin's median had landed.
Key numbers
The geographic pattern of decline was not uniform. The city's urban core, anchored by walkable neighborhoods within a few miles of downtown, proved more resilient than the outer suburbs. Del Valle, Pflugerville, and the eastern edges of the metro saw some of the sharpest absolute-dollar reversals because those areas had attracted the most speculative buying — investors and owner-occupants alike who assumed appreciation would continue and could not sustain prices once rates moved. Travis County's assessor rolls captured the shift in taxable values, though appraisal methodology and statutory caps create a lag between market declines and assessed-value adjustments that the Texas comptroller's office has documented.
What a Correction at This Scale Means
A fall of more than 20 percent from peak leaves several categories of buyer in distress. Anyone who purchased at or near the 2022 apex with a small down payment is now underwater or close to it — carrying a mortgage balance that exceeds the market value of the asset. Negative equity does not automatically trigger foreclosure, but it removes mobility: a household that cannot sell without bringing cash to closing is, in practical terms, stuck. The degree to which this applies across the Austin market is difficult to quantify precisely, because down-payment size and purchase timing vary by buyer and loan type, but the zip codes where appreciation was steepest are also the zip codes where speculative purchases were most common.
For sellers willing to accept current prices, the correction has produced a market that moved decisively from the seller's conditions of 2021 and 2022 toward something closer to balance. Days on market lengthened substantially — Austin Board of Realtors data showed median days on market roughly doubling between mid-2022 and 2024, from under two weeks to more than a month in many segments. Price reductions before closing, which had been nearly absent at the peak, became routine. The leverage that had allowed sellers to waive inspection contingencies and demand non-refundable deposits evaporated.
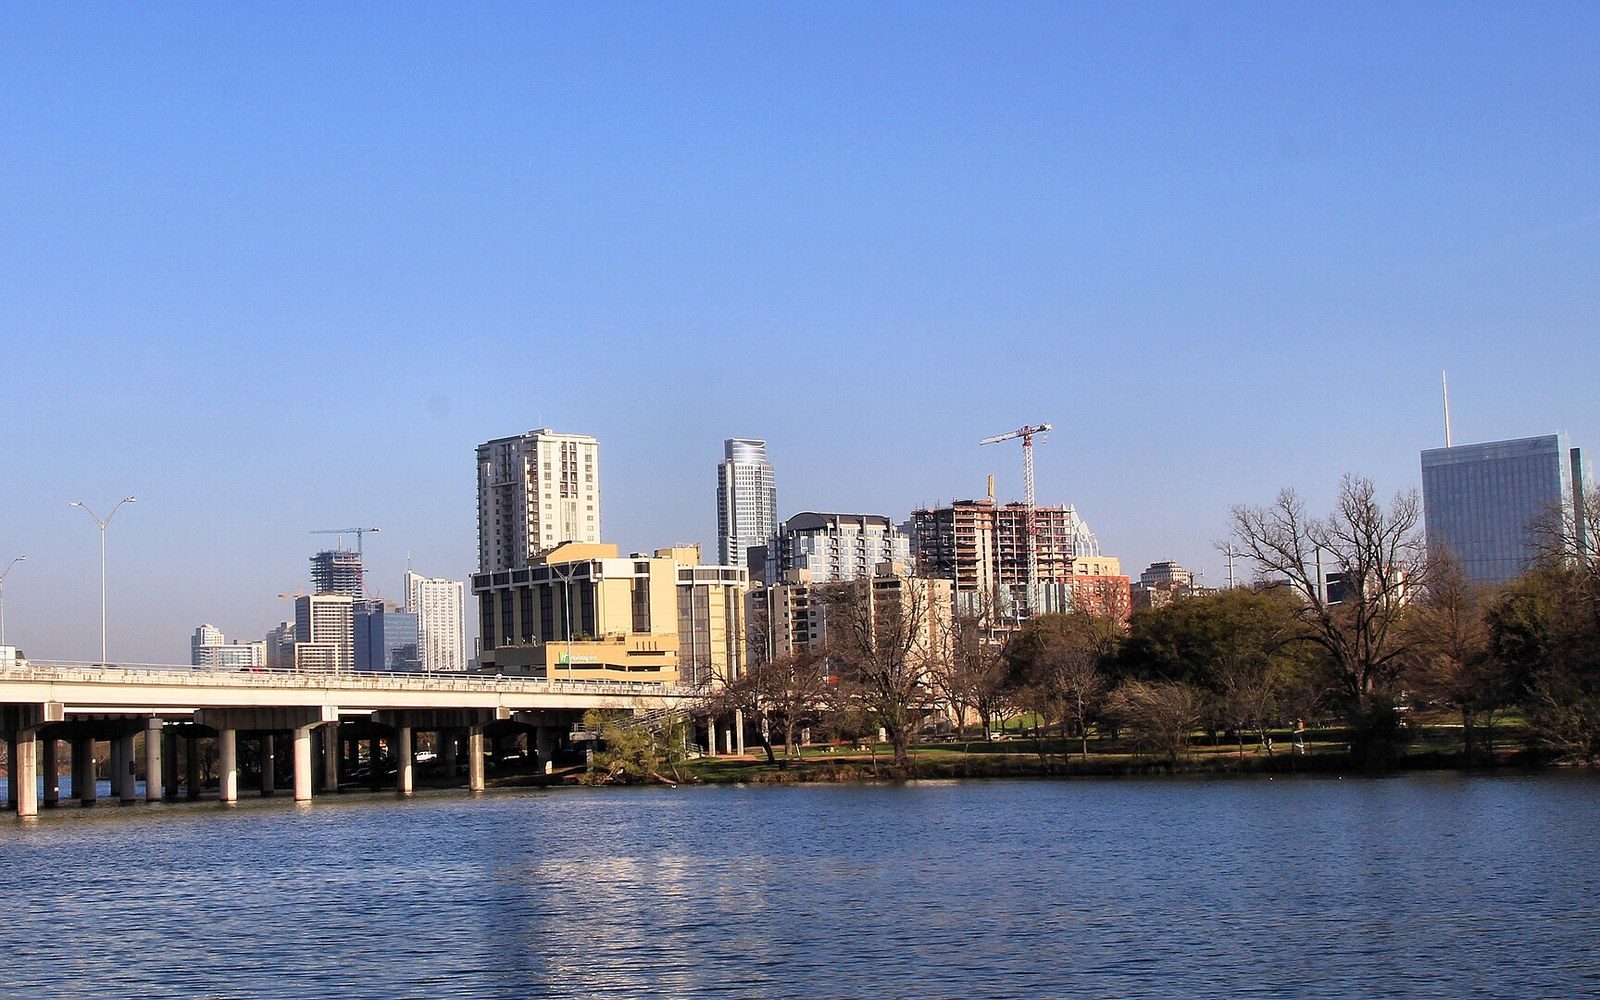
Towers that broke ground in the boom finished into a softer leasing market.
Photo: Austin Downtown 2018 · Wikimedia Commons
For buyers, the arithmetic remains difficult, though for a different reason than in 2022. Then, prices were high and competition ferocious; now, prices are lower but mortgage rates have kept monthly payments elevated relative to incomes that did not rise as fast as either prices or rates. A household buying at the 2025 median at a 7-percent rate carries a monthly principal-and-interest payment well above what a buyer at the 2020 baseline faced at 3 percent — the arithmetic of rate and price interacting to leave affordability compressed regardless of which direction the market moved. That compression is not unique to Austin, but it is acute in a city whose renter population watched asking rents spike after 2021 and is now watching them soften without the benefit of ownership equity to cushion the transition.
The civic consequences extend beyond individual balance sheets. Austin's budget during the boom years was supported by rising property-tax revenues, even as the state's homestead exemption cap limited annual increases for owner-occupants. Commercial and investment properties that reassess more directly to market value will reflect the correction in taxable values more quickly, and several large commercial properties whose appraisals are already in dispute before the Travis County Appraisal Review Board signal the shape of future revenue pressure. The city and school districts that relied on assessed-value growth to fund expanded services will find that math considerably harder through the middle of the decade.
None of that implies permanent damage. Austin's population continued to grow through the correction; the University of Texas and the state government provide employment that is less volatile than the tech sector; and the infrastructure of a young, ambitious city — the airport expansions, the semiconductor investment in nearby Taylor — creates conditions for eventual re-absorption of excess supply. But the distance back to the April 2022 peak, measured in dollars or in years, is substantial, and any honest accounting of Austin's post-boom moment begins with the recognition that the city did not merely experience a correction. It experienced the largest correction, measured from peak, of any major American city in this cycle.